jar546
Forum Coordinator

If you have any corrections or disputes, please comment below.
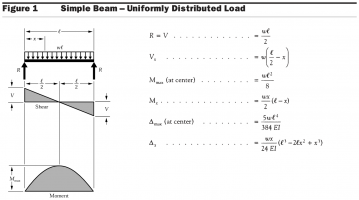
Figure 1 from the document titled "Beam Design Formulas with Shear and Moment Diagrams" presents a simple beam subjected to a uniformly distributed load. This figure is foundational for understanding the behavior of beams under distributed loads, which are common in many structural applications. Here's a breakdown of the key components and calculations provided in Figure 1 for a simple beam with a uniformly distributed load:
Description of the Beam and Load
- The beam is depicted as a straight, horizontal member supported at both ends, indicating a simple or supported beam configuration.
- The load is uniformly distributed across the entire length of the beam, denoted by "w" (in lbs./in. or kN/m), representing the load per unit length.
Shear Force Diagram (V)
- The shear force diagram shows how the shear force (V) varies along the length of the beam.
- At the supports, the shear force is equal to half the total applied load, indicating that the reactions at the supports are equal and balance the applied load.
- The shear force linearly decreases to zero at the midpoint of the beam. This linear variation is due to the uniform distribution of the load across the beam length.
- The shape of the shear force diagram is triangular, highlighting the linear change in shear force from the supports towards the center.
Moment Diagram (M)
- The moment diagram illustrates the bending moment (M) experienced by the beam at any point along its length.
- The bending moment is maximum at the midpoint of the beam and zero at the ends (supports). This pattern reflects the beam's tendency to bend under the distributed load, with the maximum bending occurring at the center where the shear force is zero.
- The maximum bending moment (M_max) can be calculated using the provided formula, which is based on the load per unit length (w), and the span length of the beam (L).
- The shape of the moment diagram is parabolic, indicating that the bending moment varies nonlinearly along the length of the beam, reaching its peak at the center.
Key Formulas
- The document provides formulas to calculate the reaction forces at the supports (R), the shear force (V) at any point along the beam, and the maximum bending moment (M_max). These calculations are crucial for designing the beam to ensure it can safely support the applied loads without failure.
