• Welcome to The Building Code Forum

    Your premier resource for building code knowledge.

    This forum remains free to the public thanks to the generous support of our Sawhorse Members and Corporate Sponsors. Their contributions help keep this community thriving and accessible.

    Want enhanced access to expert discussions and exclusive features? Learn more about the benefits here.

    Ready to upgrade? Log in and upgrade now.

Interpolate and Extrapolate

jar546

CBO
Joined
Oct 16, 2009
Messages
13,000
Location
Not where I really want to be
We know that in the IRC tables, we could interpolate to find a fitting value, but we cannot extrapolate because that is projecting. The AWC DCA-6 Manual, one of my favorites, specifically tells you that you can interpolate but you cannot extrapolate their tables and charts.

Does the IRC also make that clear?
 
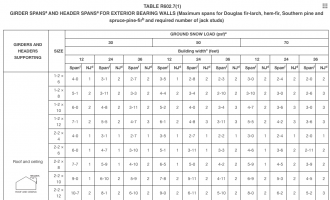
Let me provide an example. Looking at the following chart, what would you consider the maximum span of a 2x10 header for a 28' wide building in a 40-lb ground snow load area? Would you just go to the 50psf column and 36' building width, or would you interpolate both or one of the two data points?

c.Building width is measured perpendicular to the ridge. For widths between those shown, spans are permitted to be interpolated.

Screen Shot 2023-12-10 at 12.30.56.png
 

Interpolate and Extrapolate​

SCBO1 has already googled "Flummoxed" so he knows what he is at the moment. :cool:

Interpolate:
verb (used with object),in·ter·po·lat·ed, in·ter·po·lat·ing.
  1. to introduce (something additional or extraneous) between other things or parts; interject; interpose; intercalate.
  2. Mathematics. to insert, estimate, or find an intermediate term in (a sequence).
Extrapolate:
verb (used with object),ex·trap·o·lat·ed, ex·trap·o·lat·ing.
  1. to infer (an unknown) from something that is known; conjecture.
  2. Statistics. to estimate (the value of a variable) outside the tabulated or observed range.
 
Last edited:
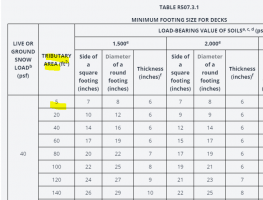
This got better in 2021, but here is a stupid example....You can't extrapolate in the deck footing table, so if you have a tributary area <5sqft you need an engineer...For what is a simple math problem..

1702302888474.png
 
This got better in 2021, but here is a stupid example....You can't extrapolate in the deck footing table, so if you have a tributary area <5sqft you need an engineer...
You can obviously use the 5 ft^2 entry for any area up to 5 ft^2, no engineer required.

Cheers, Wayne
 
You can...the code just doesn't allow it...

View attachment 12269
That is ridiculous. Why would you even begin to think that you cannot use the tributary area values as a maximum?

Every span table (or similar) in the IRC is indicating a maximum length of span, max tributary area, etc. They are maximum values. If the tributary area is less than 5sf and you assume 5sf per the table, you oversize the footing just slightly. Why would that be an issue?

Rounding up to the minimum value listed in the table is not extrapolation.
 
1702313876264.png

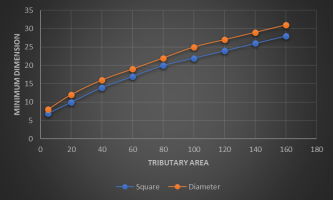
You can plot to any point on one of the two lines shown. What you cannot do is forecast (extrapolate) beyond the 160sf tributary area. Nor, can you extrapolate to a footing size less than the minimum values in the table. Basically, the smallest footing you can do is 7-in square or 8" round.

But there is no issue picking any point on the lines shown in the graph. And there is no issue with rounding the tributary area up to the first value listed in the table.
 
Maybe they should have put a less than or equal to 5' then, similar to what they did for soil >3000#....don't shoot the messenger, I am just pointing out a flaw in the IRC...You are extrapolating to what is not in the table (<5' trib) which is not allowed per the footnote....Same thing you could/ would/ might do if you had "known" 4000# soil....if it let you....

I had no issues doing the math previously (personally), but once there is a chart, you are kinda sorta bound to the chart...Kind of sort of like the IRC not allowing center deck beams....
 
You are extrapolating to what is not in the table
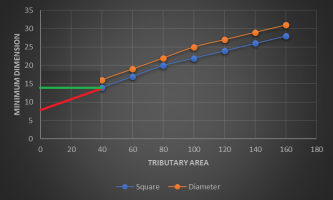
What is proposed is not extrapolating. I modified classicT's nice graph to show the difference. I cut off the data below 40 sq ft just for better illustration, so it is as if the table's smallest entry were 40 sq ft.

In the modified graph below, using the red line as an extension of the blue curve would be extrapolating. Using the green line is what is proposed, and that's not extrapolating. It's just recognizing that the curve is an increasing curve, so whatever the value should be below 40 sq ft, that value must be no more than the value at 40 sq ft. So it is safe to use the value at 40 sq ft for anything smaller than 40 sq ft.

This is so obvious that no explicit language like "maximum" or "less than or equal to" is required in the code section.

Cheers, Wayne

1702313876264.png
 
Maybe they should have put a less than or equal to 5' then, similar to what they did for soil >3000#....don't shoot the messenger, I am just pointing out a flaw in the IRC...You are extrapolating to what is not in the table (<5' trib) which is not allowed per the footnote....Same thing you could/ would/ might do if you had "known" 4000# soil....if it let you....

I had no issues doing the math previously (personally), but once there is a chart, you are kinda sorta bound to the chart...Kind of sort of like the IRC not allowing center deck beams....
It is correct that you cannot extrapolate to less than 5sf. You cannot go smaller than that top row. But there is no reason you cannot use the next higher value.

You would not make someone with 30sf of tributary find the exact footing size by interpolating (plotting on the graph). You'd allow them to go to the 40sf row and use 14-in square or 16-in diameter footing.

How is it different, rounding up to the 5sf row than going to the 40sf row when you have 30sf trib? Remember that interpolation is permitted, not required.
 
This was so obvious that we didn't need a code section and crappy chart for it.....But hey....
Yeah, OK, maybe that was a not very helpful throwaway comment.

Nonetheless, your complaint is that it is extrapolation. It's not extrapolation, and the graph in my previous post illustrates the difference.

Cheers, Wayne
 
The problem is we are not "given 0" as an option or an absolute minimum......We all know what happens between 0 and 5, and it is not an issue, realistically, just bad code writing...

Interpolation means to estimate the value of a point between two given points in a data set. For example, if a child's height was measured at age 5 and age 6, interpolation could be used to estimate the child's height at age 5.5.

How is it different, rounding up to the 5sf row
Because 5 is as low as it goes so there is nothing to round up from....so it is extrapolation, not interpolation...


Almost as crappy as arguing that the only numbers in play for interpolation are actually the soil loads, because that is where the footnote (a) lives, not with the minimum footing size header or tributary area column :

1702318504106.png
 
Because 5 is as low as it goes so there is nothing to round up from....so it is extrapolation, not interpolation...
No extrapolating would be trying to calculate the size for a 2sf trib load. Using 5sf, even though the trib is 2sf, is not extrapolating. It is using the limiting row.
 
Because 5 is as low as it goes so there is nothing to round up from....so it is extrapolation, not interpolation...
It's neither extrapolation nor interpolation. For a linear function f, and for any constant a, f(ax + (1-a)y) = a f(x) + (1-a) f(y). Then for any function f:

Linear interpolation: Pretend f is linear between x and y, and use the formula for 0 < a < 1.

Linear extrapolation: Use the formula for other values of a, outside the interval (0,1).

But we aren't using the formula at all. All we are saying is that f is monotonic increasing, meaning that if x < y, f(x) < f(y). Now apply that to any x < 5 sq ft, and y = 5 sq ft.

Cheers, Wayne
Now that’s an example of a nuclear reply. I understood some of the words, a few of the letters and none of the numbers.
 
Let me provide an example. Looking at the following chart, what would you consider the maximum span of a 2x10 header for a 28' wide building in a 40-lb ground snow load area? Would you just go to the 50psf column and 36' building width, or would you interpolate both or one of the two data points?

c.Building width is measured perpendicular to the ridge. For widths between those shown, spans are permitted to be interpolated.
Obviously it is OK to interpolate with respect to building width. Whether the code language permits interpolating with respect to ground snow load is unclear to me. It's a question of legal nuances that I'm unfamiliar with.

If the only mention of interpolation on the chart, instead of (c) above, were "interpolation is not permitted for ground snow load," then I'm familiar with the legal principle that that implicitly permits interpolation on all other factors, as if any other factors were also prohibited, they would be called out explicitly in the prohibition.

However, I'm unclear if the converse of that applies as a legal principle--that since interpolation is explicitly allowed for some cases, it is implicitly disallowed for others. The way that various charts in the IRC explicitly permit interpolation in some cases, I was expecting to find a general statement in Chapters 1 or 2 that interpolation is disallowed except where explicitly permitted. However, I don't see any such statement, and so I find it ambiguous whether interpolation is allowed when neither explicitly permitted nor explicitly prohibited. Or have I missed a general statement in the IRC that bears on this question?

Cheers, Wayne
 
On the physics of the question of interpolation with respect to this particular chart, if I'm not mistaken, a formula for maximum header length as a function of all the relevant parameters is going to be concave up (positive second derivative) for both building width and ground snow load. That would mean that a linear interpolation between two points determined by the formula would give you a value greater than the actual formula gives, and would therefore be non-conservative.

You can see this just by studying the chart--if you average the header lengths for 12' and 36' for any given header option and ground snow load, you get a header length longer than the chart entry for 24'. Likewise, if you average the header lengths for 30 psf and 70 psf ground snow load, for a specific building width and header option, you get a header length longer than the chart entry for 50 psf ground snow load.

So I'm a little surprised that interpolation is allowed at all. Of course, since the building widths provided are so infrequent, if linear interpolation were disallowed for building width, the chart would need a lot more columns for building width. Whereas the 3 options supplied does a better job of covering the range of ground snow loads.

Given the above, I would not be inclined to interpolate with respect to ground snow load, as it is arguably non-conservative. I'm not sure what's going on with building width, since interpolation is obviously allowed; maybe the chart makers intentionally reduced the allowable length at 24' to ensure that interpolation with the numbers given is conservative.

Cheers, Wayne
 
What is proposed is not extrapolating. I modified classicT's nice graph to show the difference. I cut off the data below 40 sq ft just for better illustration, so it is as if the table's smallest entry were 40 sq ft.
Of course it's extrapolating. The table doesn't list the first entry for tributary area as "5 s.f. or less" or "up to 5 s.f.," it lists 5 s.f. So that's as low as the table goes, and dealing with any tributary area less than 5 s.f. is off the table -- extrapolation.

As steveray posted:

The problem is we are not "given 0" as an option or an absolute minimum......We all know what happens between 0 and 5, and it is not an issue, realistically, just bad code writing...
 
However, I'm unclear if the converse of that applies as a legal principle--that since interpolation is explicitly allowed for some cases, it is implicitly disallowed for others. The way that various charts in the IRC explicitly permit interpolation in some cases, I was expecting to find a general statement in Chapters 1 or 2 that interpolation is disallowed except where explicitly permitted. However, I don't see any such statement, and so I find it ambiguous whether interpolation is allowed when neither explicitly permitted nor explicitly prohibited. Or have I missed a general statement in the IRC that bears on this question?

You won't find a general statement because it's not there. Not all tables in the ICC codes allow interpolation. Where interpolation is allowed, the code says so at that table. If nothing in a table or in the code section pertaining to that table says interpolation is allowed -- then interpolation is not allowed.
 
Of course it's extrapolating.
See the graph in post #11. The red line is linear extrapolation; the green line is just a conservative bound. I'm proposing using the green line, not the red line.

Edit: to expand on the difference: extrapolating would be saying "the trend suggests the value is X." To bound is to say "I'm not sure what the value would be, but it's definitely less than or equal to Y." And in this case an upper bound is conservative, so using an upper bound suffices.

Cheers, Wayne
 
Last edited:
Back
Top