Sifu
SAWHORSE
- Joined
- Sep 3, 2011
- Messages
- 3,567
Where am I going wrong, or am I? Given: Type IIB, 2 story, A4
For allowable area calculations with frontage using the 2018 IBC:
First is frontage using 506.3.3, equation 5-5
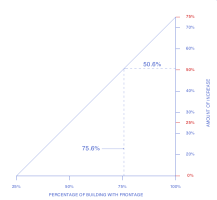
If= [ F/P-.25 ] W/30
If= [ (604/7980)-.25 ]30/30
If= [ .756 - .25 ] 1
If= .506 * 1
If= .506
Next is allowable area using 506.2.3, equation 5-2
Aa= [At + (NS * If) * Sa
Aa= [28,500 + (9,500 * .506)] *2
Aa= [28,500 + 4,807] *2
Aa= 33,307 * 2
Aa= 66,614 (total of floors) or 33,307 per floor
Now, same building using 2021 IBC:
First is frontage using Table 506.3.3,
604/798=75.6 corresponds to an allowable increase of 75%
Next is allowable area using 506.2.1, equation 5-2
Aa= [At + (NS * If) * Sa
Aa= [28,500 + (9,500 * .75)] *2
Aa= [28,500 + 7,125) *2
Aa= 35,625 * 2
Aa= 71,250 (total of floors) or 35,625 per floor
My first question is with frontage. Where are we directed by the 2021 code that in t506.3.3, the "percentage of building perimeter" column is the result of the 2018 F/P? Seems like it should be there. It may be obvious to some, but not all. Or am I misunderstanding it?
Next, comparing the 2018 with the 2021 methods for determining the frontage, there would appear to be a 25% increase in frontage by virtue of the fact that the old formula subtracted .25 from the F/P. I ask because I thought there was not supposed to be an actual change in the results, but just a new (easier) way of doing it, but maybe I am wrong about that.

