steveray
SAWHORSE
No....only a NEMA OS 4 box does.....Alternate means and methods maybe....Can they all comply with N1102.4.6?
shall be marked "NEMA OS 4" or "OS 4" in accordance with NEMA OS 4.
Your premier resource for building code knowledge.
This forum remains free to the public thanks to the generous support of our Sawhorse Members and Corporate Sponsors. Their contributions help keep this community thriving and accessible.
Want enhanced access to expert discussions and exclusive features? Learn more about the benefits here.
Ready to upgrade? Log in and upgrade now.
No....only a NEMA OS 4 box does.....Alternate means and methods maybe....Can they all comply with N1102.4.6?
shall be marked "NEMA OS 4" or "OS 4" in accordance with NEMA OS 4.
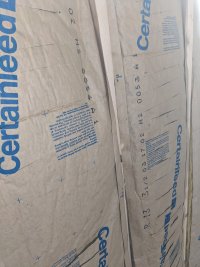
Agreed - to a point. With foam - either solid or with a couple of inches to exterior (in a heating climate) the dew point must be within the foam to not cause moisture problems. And in my 12" of fibreglass, the dew point must be within it, but no surface. You really want to avoide a surface in a wall or roof - like the inside of sheathing - from being below the dewpoint. The double vapor barrier is the concern the second one may become that condensing surface.That's the critical concern with vapor barriers -- you don't want the dew point to occur within the insulation
Since these walls are 12" of fibreglass, I'd expect that graph to be a pretty straight line.
My wall is 2x4 16 o. c. with R13 batts; 5 1/2" R19 batts horizontal, no framing; and then another 2x4 16 o.c. with R13 batts. So pretty close to same density through the wall. Of course the wall changes at the inner and outer surfaces. I'm sure the slashed kraft paper introduces a blip in the graph.And in this case there isn't a single 12-inch batt, there's an existing wall with unspecified thickness batts, then a new, inner wall with 8-inch batts.
Never seen a client try the drywall approach. I'd figure a critical failure point would be electrical outlets. We have enough challenge with electrical outlet sealing in standard construction as it is.
Interesting. I'll check out the calculators.
My wall is 2x4 16 o. c. with R13 batts; 5 1/2" R19 batts horizontal, no framing; and then another 2x4 16 o.c. with R13 batts. So pretty close to same density through the wall. Of course the wall changes at the inner and outer surfaces. I'm sure the slashed kraft paper introduces a blip in the graph.
12" wall leaves 5". Sure looks like the compression is spread across all three layers.And how much physical space between the two 2x4 walls? If it's less than the full 5-1/2" of the R-19 batts, then the batts aren't giving you R-19.